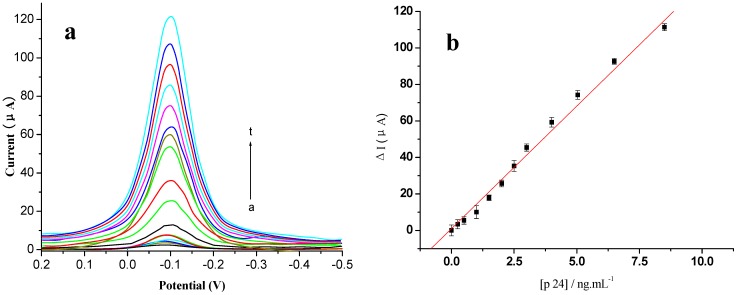
Figure 8.
Voltammogram of the modified electrode using different concentrations of antigen (0~10 ng/mL, respectively) (a) DPV curves; (b) plot of ΔI vs. the concentrations of p24. All experiments were carried out in 0.01 mol/L PBS, 0.1 mol/L KCl (pH 7.4) and added 5 mmol/L HQ and H2O2, at a potential range of 0.2 V to −0.5 V, vs. SCE. Scan rate 50 mV/s.

