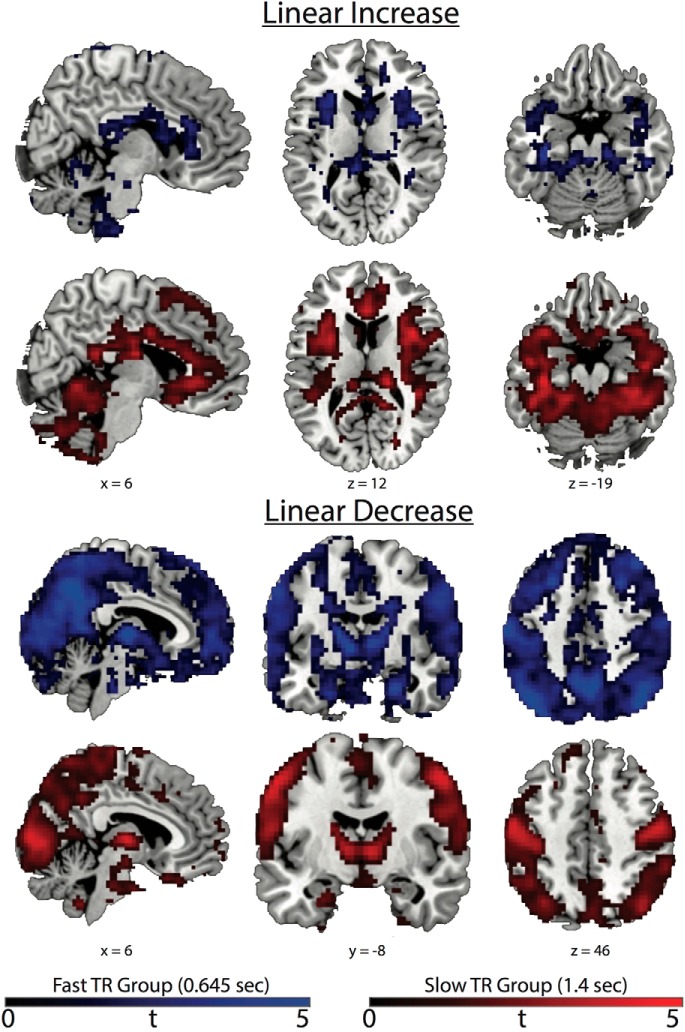
Figure 2.
Liberal voxelwise corrected (p < 0.40 uncorrected) t-maps without cluster correction. Blue represents the fast TR group and red represents the slow TR group. General linear MSSD increases can be seen in SN nodes such as the bilateral anterior insula and anterior cingulate cortex and also in the VTC. General linear MSSD decreases can be seen in subcortical, visual, sensorimotor, DMN (posterior cingulate and medial prefrontal cortex), and CEN (supramarginal gyrus and dorsal–lateral prefrontal cortex) brain areas. Colored bars represent t values.

