Figure 4.

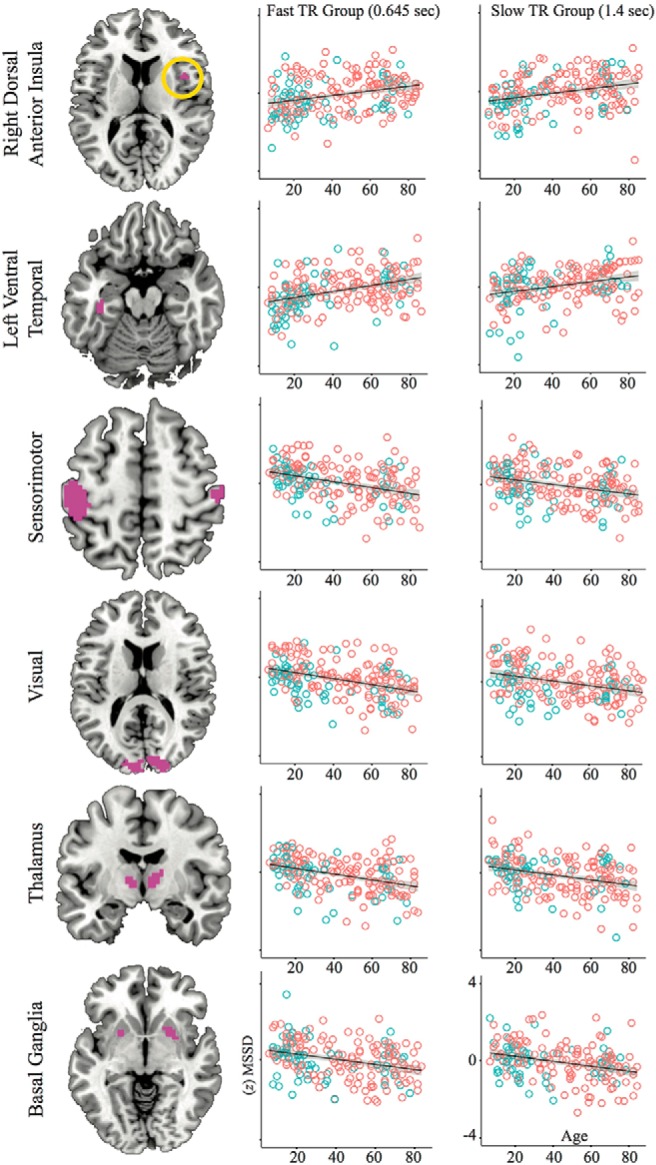
Scatterplots depicting linear MSSD effects across the lifespan. ROIs were taken from areas of cluster-corrected TR group overlap (violet colors) in Figure 3. Blue circles are males and red circles are females.

Scatterplots depicting linear MSSD effects across the lifespan. ROIs were taken from areas of cluster-corrected TR group overlap (violet colors) in Figure 3. Blue circles are males and red circles are females.