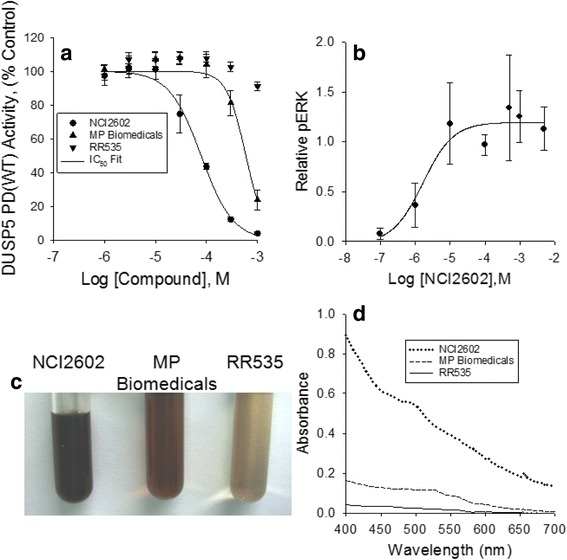
Fig. 2.

NCI2602 IC50 determinations for DUSP5 PD(WT) and DUSP5(WT) activities using pNPP and pERK as substrates, respectively. a DUSP5 PD(WT) initial velocity versus increasing concentrations (1 to 1,000 μM) of NCI2602, MP Biomedicals and RR535 (two additional sources of NCI2602), using pNPP as the substrate. Lines represent the data fit to Eq. 1 resulting in calculated IC50 values of 78.5 ± 5.4 μM and 593.5 ± 64.1 μM (calculated IC50 value ± SE) for NCI2602 and MP Biomedicals, respectively. The model was unable to fit the RR535 data (did not converge) at the assayed concentrations. Data points represent the mean ± SD of three or four trials, with four to eight wells at each compound concentration. b Relative DUSP5(WT) activity versus increasing concentrations of NCI2602 utilizing pERK as the substrate. The data points, generated from normalized image intensities, represent the mean ± SD of three experiments. A global model fit of the three data sets resulted in an estimated IC50 (± SE) value of 1.7 ± 1.2 μM. c Photographic images of 25 mM stock concentrations of NCI2602, MP Biomedicals and RR535 used for the IC50 determinations in (a). d Absorbance spectra from 400 to 700 nm of 1.8 mM concentrations of NCI2602, MP Biomedicals and RR535 in DMSO with DMSO as the blank
