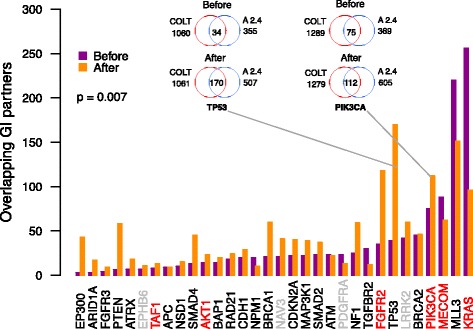
Fig. 5.

Reproducibility of genetic interaction partners of cancer drivers before and after cleaning the shRNA datasets. The number of overlapping genetic interaction (GI) partners of major cancer driver genes commonly detected in both shRNA datasets, before and after their cleaning by removal of shRNAs with a high tendency for off-target seed effects (defined by SPS and TA seed sequence properties; see Fig. 4 legend). The cleaning resulted in improved consistency of GI detection (p = 0.007, one-sided Wilcoxon signed rank test). The pan-cancer GI partners for each driver were defined based on statistical comparison of the geneES between mutated and non-mutated cancer cell lines (p < 0.05, Wilcoxon rank sum test). “A 2.4” indicates the Achilles 2.4 study. The Venn diagrams illustrate the number of overlapping GI partners of TP53 and PIK3CA, as examples of loss-of-function (LoF) and activating driver mutations, respectively. The LoF (black), activating (red), and unclassified (grey) status of the driver mutations was extracted from the IntoGen platform (https://www.intogen.org/)
