Fig. 2.

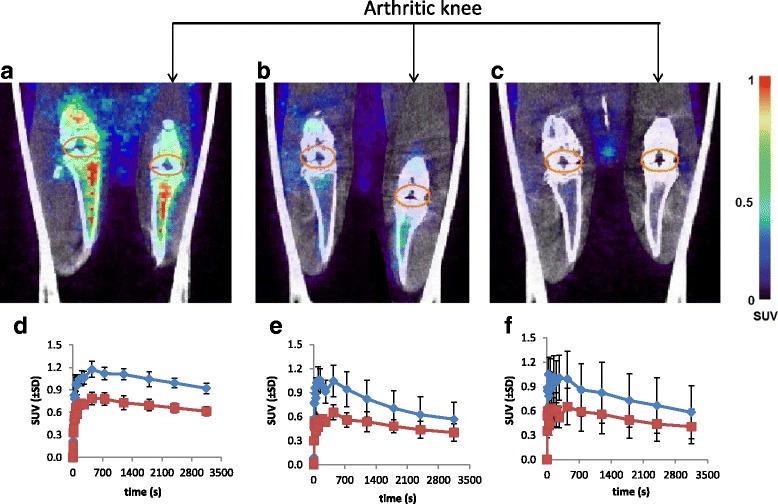
Representative coronal PET-CT scans of [18F]fluoro-PEG-folate in control and arthritic rats. a Control (before therapy, day 22); b 2× MTX and c 4× MTX (after therapy, day 40). Orange ellipsoid: ROI drawn around the synovium of the knee joint. Arthritic (right) and contralateral knees (left) depicted on each image. Standardized uptake value (SUV) scale bar from minimum 0 to maximum 1, represent the uptake of the tracer. TACs of [18F]fluoro-PEG-folate uptake are expressed as SUV (±SD) in arthritic and contralateral knees of the control group (d), 2 × -MTX group (e) and 4 × -MTX group (f)
