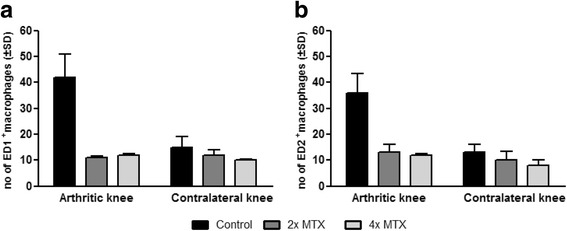
Fig. 5.

Quantification of ED1+ and ED2+ synovial macrophages in knee sections of control and treated rats. a ED1+ synovial macrophages, 6 days after the third boost, of control rats (black bars) and 2 × -MTX (dark grey) and 4 × -MTX (light grey) rats. b ED2+ synovial macrophages, 6 days after the third boost, of control rats (black bars) and 2 × -MTX (dark grey) and 4 × -MTX (light grey) rats. Values represent mean number of macrophages counted in predefined areas of the synovium. Error bars indicate SD. MTX methotrexate, SD standard deviation
