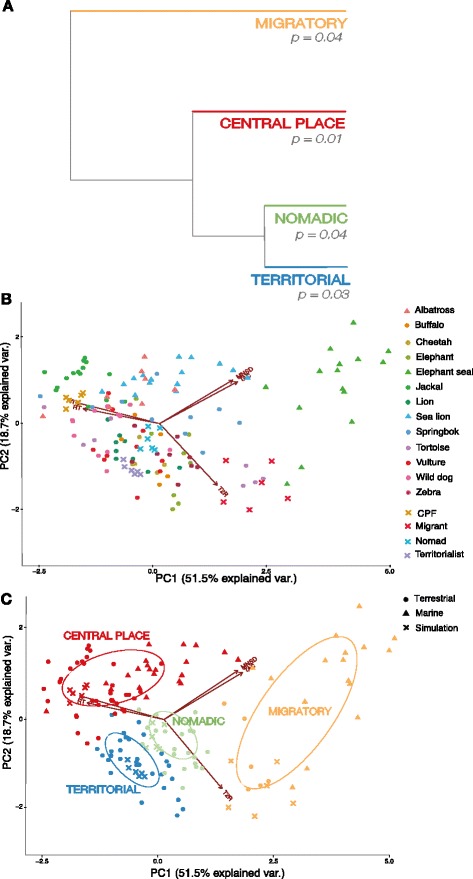
Fig. 2.

a Dendrogram tree displaying results of Ward hierarchical cluster analysis of all individuals based on PC1 and PC2 values, and bootstrapped p-values for each cluster. See Additional file 3: Figure S1 for full display of individual leaves within each major cluster. b Scatterplot of individuals based on PCA-defined axes. Simulated individuals are plotted for reference, although not included in the PCA. c Scatterplot of classified individuals based on PCA-defined axes. Ellipses represent the 50% probability contour for cluster classifications
