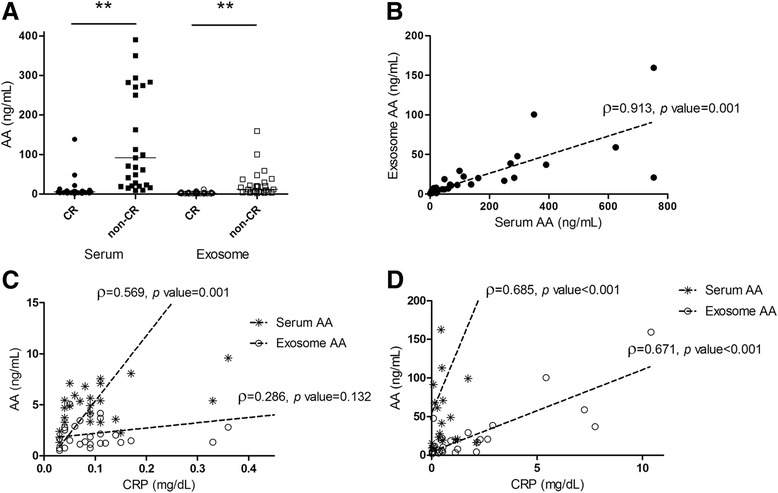
Fig. 1.

Concentration and correlation of AA. a Level of serum AA and exosomal AA in CR group and non-CR group. ** p < 0.01. b Correlation between exosomal AA and serum AA. c Correlation between CRP and AA in CR group (serum and exosome). d Correlation between CRP and AA (serum and exosome) in non-CR group. AA Amyloid A, CR Clinical remission, CRP C-reactive protein
