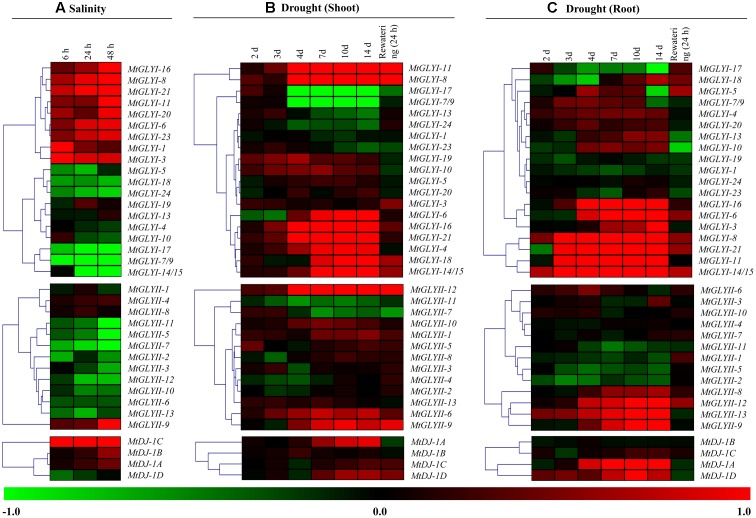
FIGURE 10.
Expression analyses of Medicago glyoxalase genes in response to two devastating abiotic stresses. Normalized and curated perturbation expression data of the Medicago glyoxalase genes were retrieved from publicly available Genevestigator Affymetrix Medicago genome array (https://www.genevestigator.com/gv/plant.jsp) using the already identified corresponding probesets of experiments with id: MT-00011 and MT-00013 (Details provided in the “Materials and Methods” section). Relative expression data of all available MtGLYI, MtGLYII, and MtDJ-1 were combined and analyzed in response to different duration of salinity (A); and drought with shoot tissue (B) and root tissue (C). Fold change of expression data was calculated by comparing with the corresponding mock samples. Heat maps with hierarchical clustering were generated using Manhattan distance metric method of MeV software package. Color scale below heat map shows the type of transcript alteration; red indicates up-regulation and green indicate down-regulation of the corresponding transcript.

