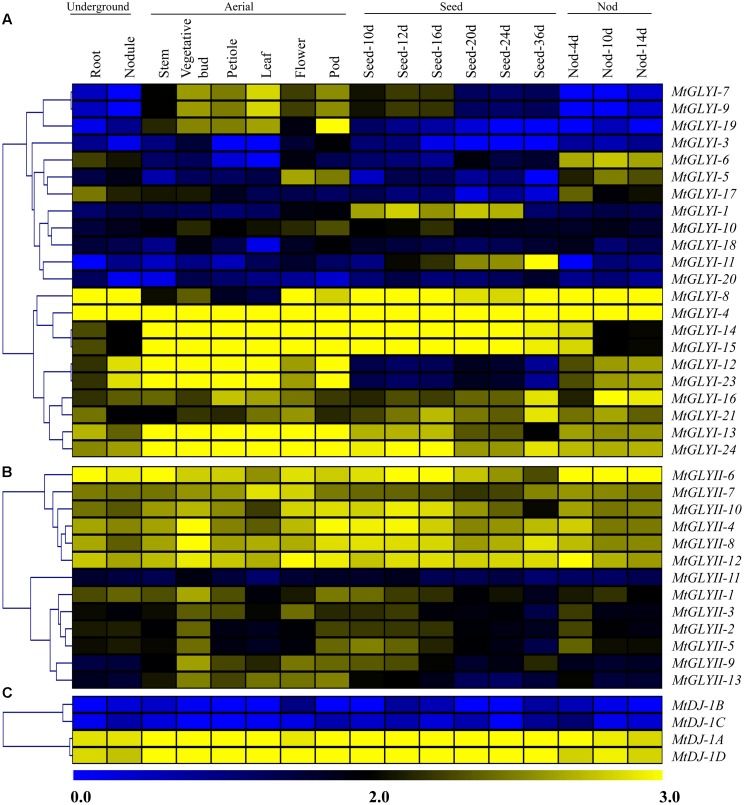
FIGURE 9.
Expression profiling of Medicago glyoxalase genes with hierarchical clustering at different developmental stages/tissues. Genome-wide microarray data of conventional GLYI (A) and GLYII (B); and novel glyoxalase III (C) genes were obtained from the Medicago truncatula gene expression Atlas (MtGEA) Project database (https://mtgea.noble.org/v2/). Normalized transcript data was obtained for 17 different tissues, including underground tissues-root and nodule; aerial tissues- stem, vegetative bud, petiole, leaf, flower, pod; seed development (seed of 10, 12, 16, 20, 24, and 36 days); and nod development (nod of 4, 10, and 14 days). These normalized expression data was used to generate heatmap with hierarchical clustering based on the Manhattan correlation with average linkage using MeV software package. Color scale below heat map shows the level of expression; yellow indicates high transcript abundance while blue indicates a low level of transcript abundance.

