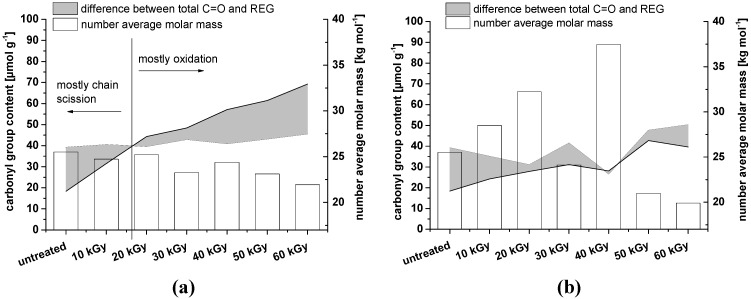
Figure 9.
Content of REG compared to the total amount of carbonyl groups (determined by fluorescence labeling). The shaded area corresponds to the difference between total C=O and REG, representing oxidation on the cellulose backbone (when the shaded area expands below the black line). As the calculation of REG is based on the number average molar mass (Mn), the data are shown as well (empty bars). (a) MFC wet; (b) MFC dry. The untreated material is identical in the two graphs.

