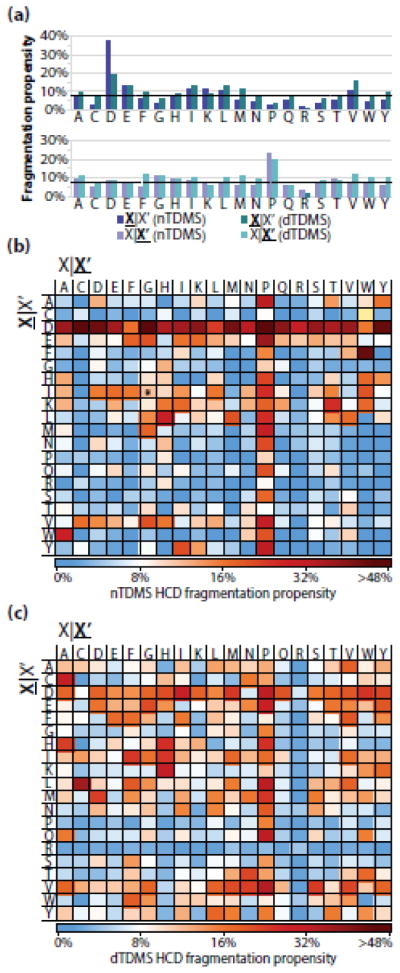
Figure 2.
(a) The HCD fragmentation propensities observed for the nTDMS dataset (purple) and dTDMS (turquoise) from Catherman, et al. [4]. The dashed black line at 8% represents the average fragmentation propensity across all residues from the nTDMS dataset. The top graph includes the fragmentation propensities for events occurring C-terminal to a given residue, whereas the bottom graph includes the fragment propensities for events occurring N-terminal to a given residue. (b) Residue fragmentation propensities for the nTDMS dataset. The asterisk on the cysteine|tryptophan pair indicates that no possible fragmentation event existed for that pair within the dataset. (c) Residue fragmentation propensities for the dTDMS dataset. For all panels, X|X’ refers to fragmentation occurring C-terminal to the amino acid residue whereas X|X’ refers to fragmentation occurring N-terminal to the amino acid residue.

