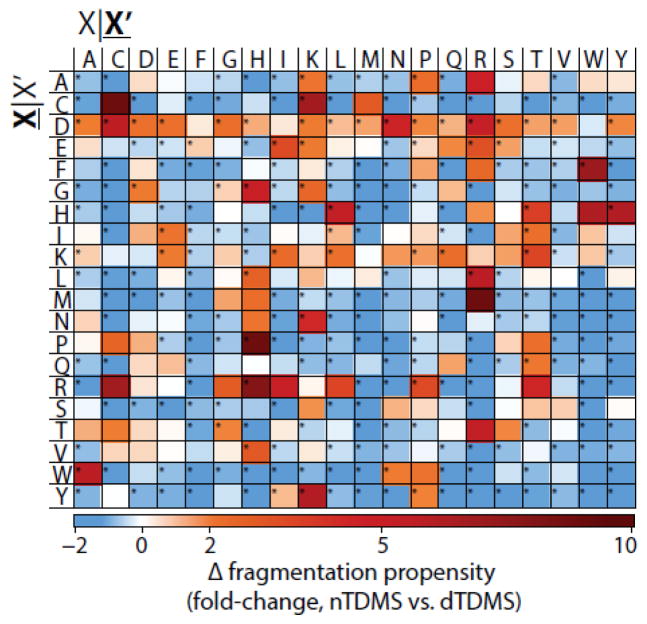
Figure 3.
nTDMS has a fewer number of highly preferred fragmentation pathways as compared to dTDMS. The fold-change in residue fragmentation propensity for nTDMS as compared to dTDMS. Blue indicates a decrease in fragmentation propensity in nTDMS as compared to dTDMS whereas red indicates an increase for nTDMS. Significant differences (p 0.05) are indicated with an asterisk. The yellow box for the cysteine|tryptophan pair indicates that no possible fragmentation event existed for the residue pair within the nTDMS dataset and, as such, a comparison cannot be made. X|X’ denotes fragmentation occurring C-terminal to the amino acid residue whereas X|X’ refers to fragmentation occurring N-terminal to the amino acid residue.

