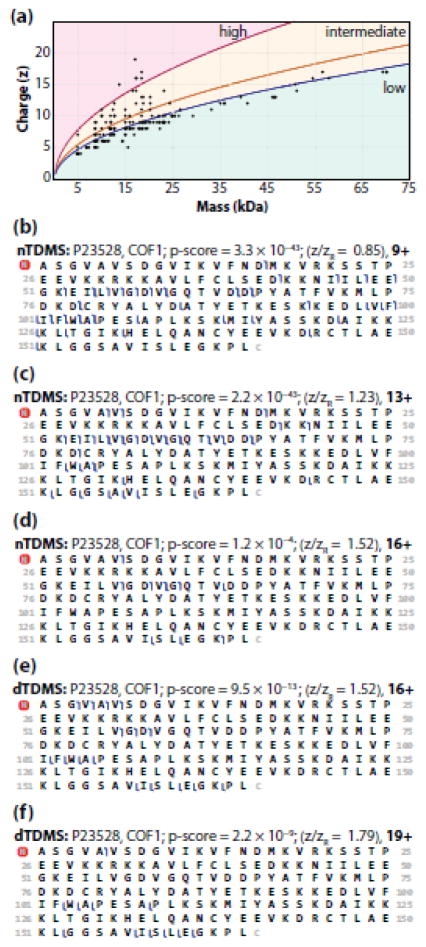
Figure 4.
(a) A relationship between charge and precursor mass. Precursor ions were selected for fragmentation without consideration for charge state designation, which resulted in the inclusion of fragmentation data from precursors with high (pink) and intermediate (yellow) charge state designations. The yellow curve (y = 0.0778m½) represents the Rayleigh charge limit for each precursor, zR (see text and [75]). The pink curve (y = 0.1081m½) is the lower bound for the high charge state designation [56], which was determined by calculating the theoretical zHigh (zHigh = zR × 1.43) for each protein in the dataset. The blue curve (y = 0.0667m½) is the upper bound for the low charge state designation [56], which was determined by calculating the theoretical zLow (zLow = zR × 0.86) for each protein in the dataset. The graphical fragmentation maps for COF1 obtained by nTDMS of a “low” (b), “intermediate” (c), and “high” (d) charge state precursor ion as compared to dTDMS [4] of an “intermediate” (e) and “high” (f) charge state precursor ion. For panels b–f, blue flags represent matched fragment ions with mass tolerance of 15 ppm.

