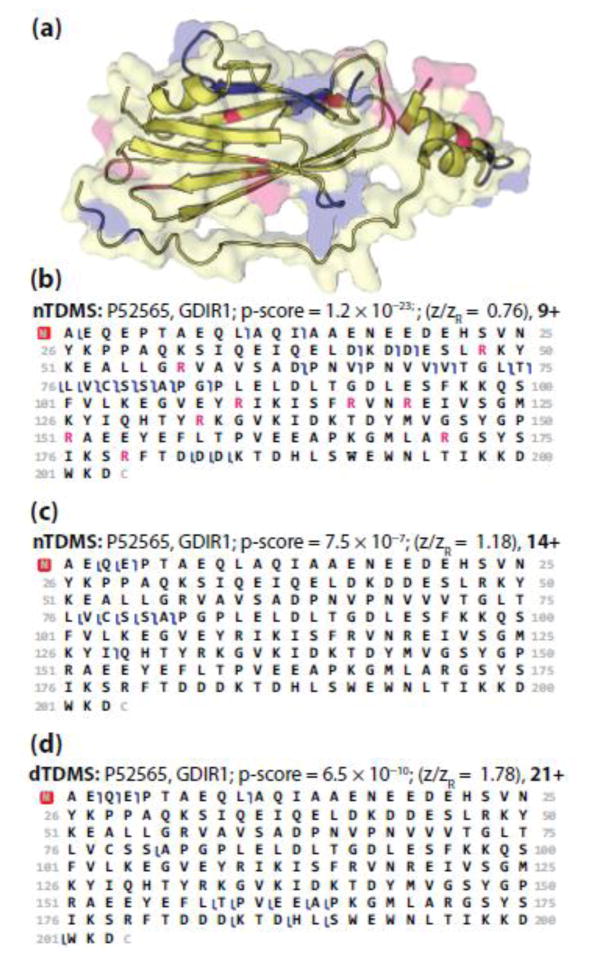
Figure 5.
(a) The surface and cartoon models of GDIR1 (PDB ID: 1hh4 [88]). Pink represents arginine residues and blue highlights the residues involved in fragmentation of the 9+ precursor ion (panel b). The two disordered regions, one at the N-terminus [A2–A7] and the other near the flexible arm [V59–P65], are not included in the crystal structure, and thus not shown. The fragmentation maps of GDIR1 obtained using nTDMS for a low (b) and intermediate (c) charge state precursor ion as compared to fragmentation of a high (d) charge state precursor ion obtained using dTDMS [4]. For panels b–d, blue flags represent matched fragment ions with mass tolerance of 15 ppm. In panel b, arginine residues are colored pink to match the arginine residues highlighted in panel a.

