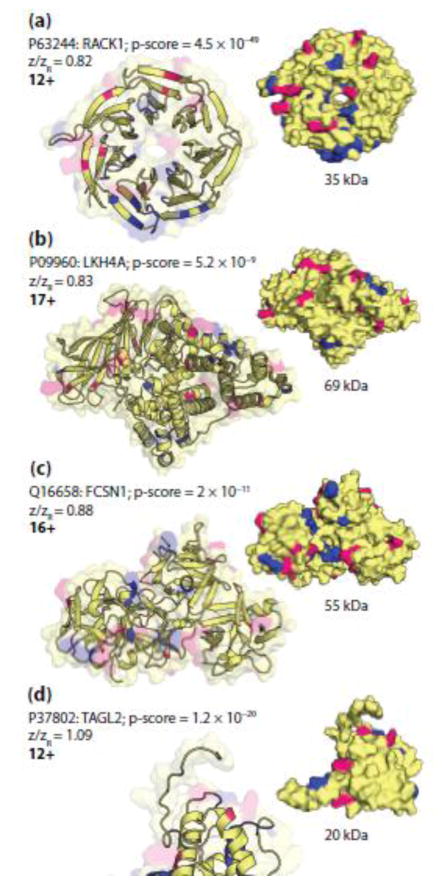
Figure 6.
The cartoon (left) and surface (right) models of (a) RACK1 (PDB ID: 4aow [89]), (b) LKH4A (PDB ID: 4rvb), (c) TAGL2 (PDB ID: 1wym), and (d) FCSN1 (PDB ID: 3llp [90]). Pink represents arginine residues and blue highlights the residues involved in fragmentation. Panels (a) and (b) represent examples of precursor ions with low charge state designations (<0.86) whereas panels (c) and (d) represent examples of precursor ions with intermediate charge state designations (0.86 < z/zR < 1.43).

