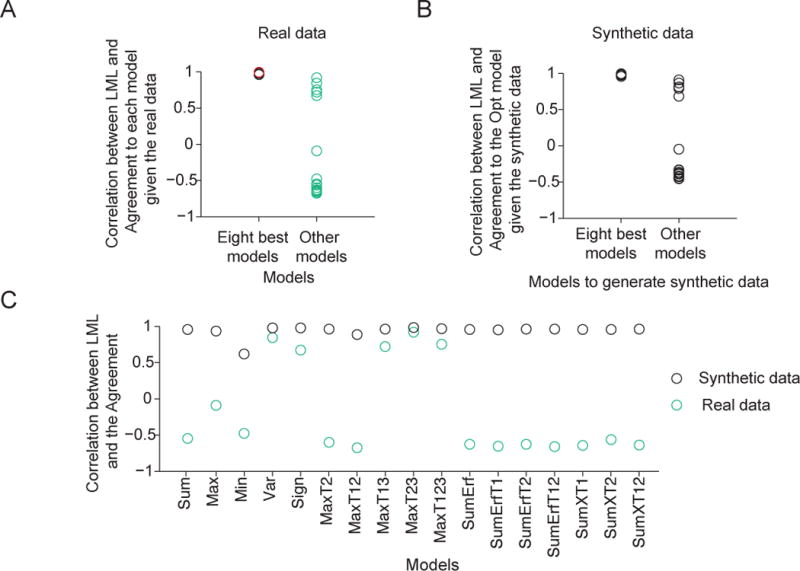
Figure 9. Correlation between log marginal likelihood and Agreement (CLA) as a potential measure of the global maximum of goodness of fit in model space.

(A) Agreement, and therefore CLA, is computed relative to a reference model. CLA is high when the reference model is the Opt model (red circle, see also Fig. 8D) or one of the seven other best models (see also Fig. A3). CLA is significantly lower when the reference model is a different model (Wilcoxon rank-sum test, p = 8.4×10⁻⁵). (B) Given synthetic data generated from one of the eight best models, CLA with the Opt model as the reference is high. Given synthetic data generated from a model outside of the eight best, CLA with the Opt model as the reference is significantly lower (Wilcoxon rank-sum test, p = 8.4×10⁻⁵, see also Fig. A4). This serves as a negative control for the high CLA with the Opt model as a reference (red circle in (A) and Fig. 8D). (C) Given synthetic data generated from any one model, the CLA with that model as the reference is high (> 0.9). Moreover, given synthetic data generated from a model outside of the eight best, the CLA with that model as a reference is significantly higher than given the real data (Wilcoxon signed-rank test, p = 2.9×10⁻⁴, see also Fig. A5). This serves as a positive control for the low CLAs with the models outside of the eight best as reference models (green circles in (A)).
