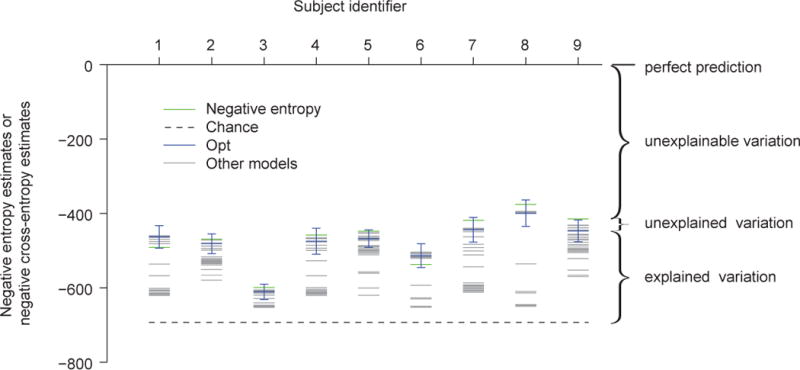
Figure 10. Information-theoretical estimate of how good the eight best models are.

Each column represents a subject. For each subject, the green line represents an estimate of the negative entropy of the data, the dashed black line the negative cross-entropy between a coin-flip model and the true model, the blue line an estimate of the negative cross-entropy between the Opt model and the true model, and the grey lines estimates of the negative cross-entropies between other models and the true model. The error bar represents an estimate of the 95% credible interval of the negative cross-entropy between the Opt model and the true model. The estimate of the negative cross-entropy between the Opt model and the true model is not significantly different from the estimate of the negative entropy of the data (one-sided Wilcoxon signed-rank test, p = 0.15), suggesting that the Opt model explains most of the explainable variation. The same holds for the seven other best models (see main text).
