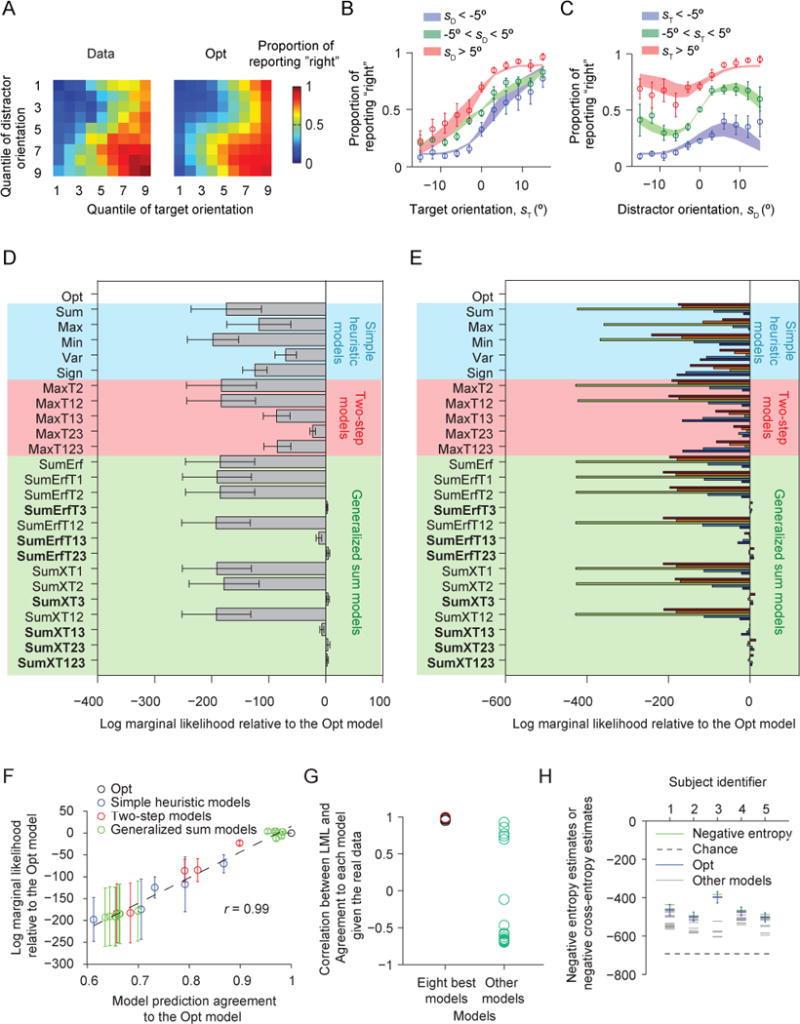
Figure 11. Results of Experiment 2, in which feedback was withheld.

(A) Proportion of reporting “right” (color) as a function of each combination of target and distractor orientation quantiles (1 to 9), averaged over all 5 subjects. The left plot shows the data, the right the fits of the Opt model. (B) Proportion of reporting “right” as a function of target orientation. Circles and error bars: data; shaded areas: Opt model fits. (C) Proportion of reporting “right” as a function of distractor orientation. (D) Mean and s.e.m. across subjects of the log marginal likelihood of each model relative to the Opt model. Shades of different colors indicate the category of a model. (E) Log marginal likelihood of each model minus that of the Opt model, for individual subjects. In the bar plots, each color represents a different subject. (F) As Fig. 8D, for Experiment 2. (G) As Fig. 9A, for Experiment 2. CLA is high when the reference model is the Opt model (red circle) or one of the seven other best models, and significantly lower otherwise (Wilcoxon rank-sum test, p = 8.4×10⁻⁵). (H) As Fig. 10, for Experiment 2. The estimate of the negative cross-entropy between the Opt model and the true model is not significantly different from the estimate of the negative entropy of the data (one-sided Wilcoxon signed-rank test, p = 0.31), suggesting that the Opt model explains most of the explainable variation. The same conclusion holds for the seven other best models.
