
Figure 12. Comparison between probability matching version of the Opt model and the Opt model.
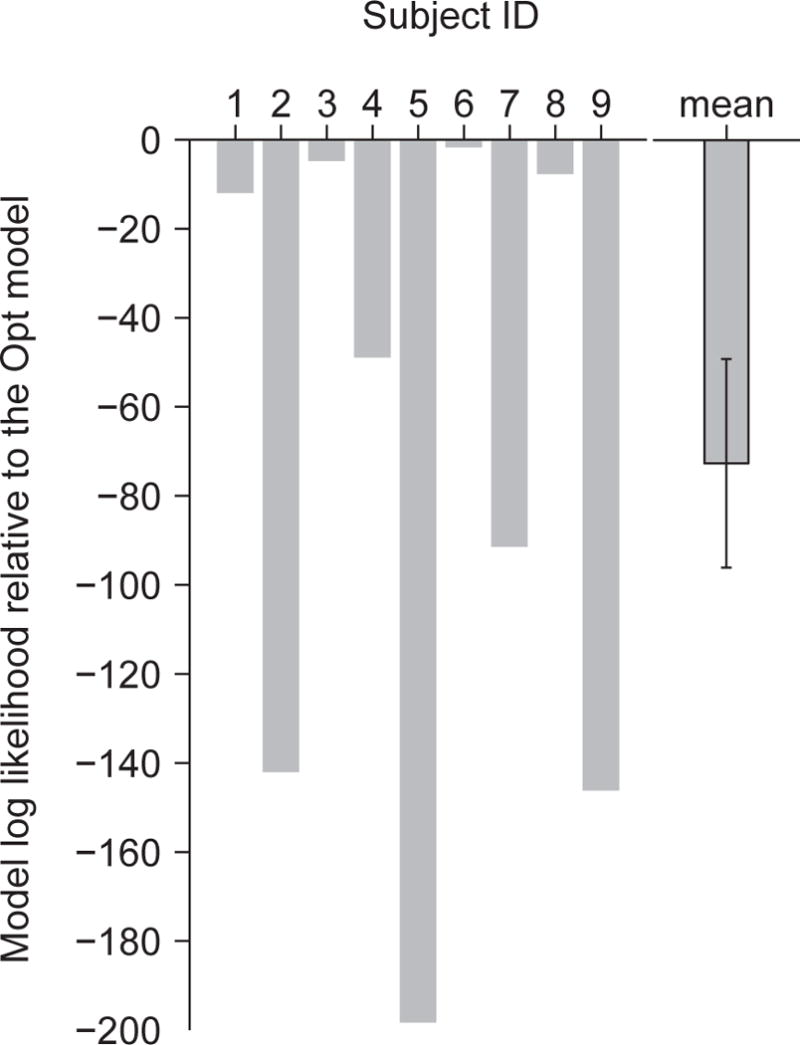
Difference in log marginal likelihood between the probability matching model and the Opt model for individual subjects. The last column shows the mean and s.e.m. of this difference.