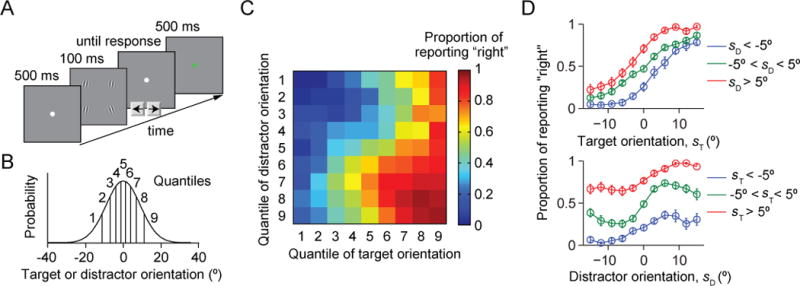
Figure 1. Task and data.

(A) Trial procedure. Each display contains four items, three of which have a common orientation; these are the distractors. Subjects report whether the fourth item (the target) is tilted to the left or to the right with respect to vertical. The target location is randomly chosen on every trial. (B) The target orientation and the common distractor orientation are independently drawn from the same Gaussian distribution with a mean of 0° (vertical) and a standard deviation of 9.06°. For plotting purposes, we divided orientation space into 9 quantiles. (C) Proportion of reporting “right” (color) as a function of target and distractor orientation quantiles. (D) Proportion of reporting “right” as a function of target orientation sT (top) and distractor orientation sD (top). Error bars are s.e.m. The top curves are not expected to be monotonic (see text).
