
Figure 4. Model fits of the two-step models.
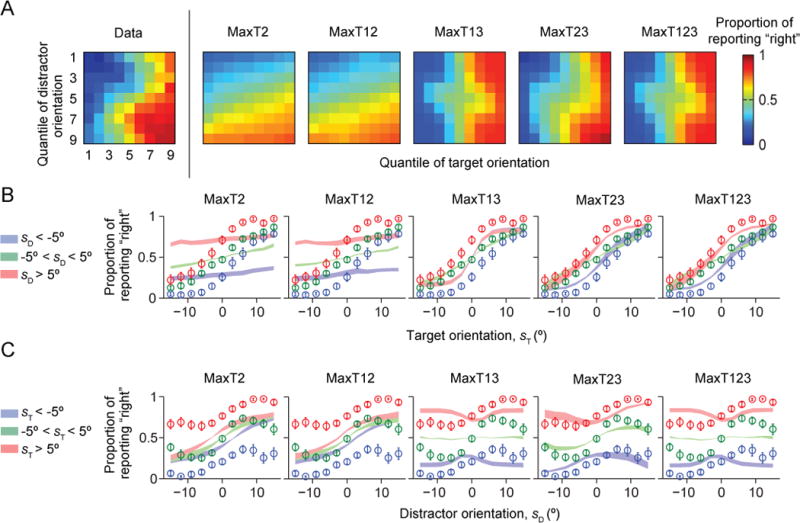
The Opt model fits better than the two-step models. (A) Proportion of reporting “right” (color) as a function of target and distractor orientation quantiles, averaged over subjects. The leftmost plot shows the data from Fig. 1C, the other plots the model fits. (B) Proportion of reporting “right” as a function of target orientation sT. Circles and error bars: data; shaded areas: model fits. (C) Proportion of reporting “right” as a function of distractor orientation sD.