
Figure 3.
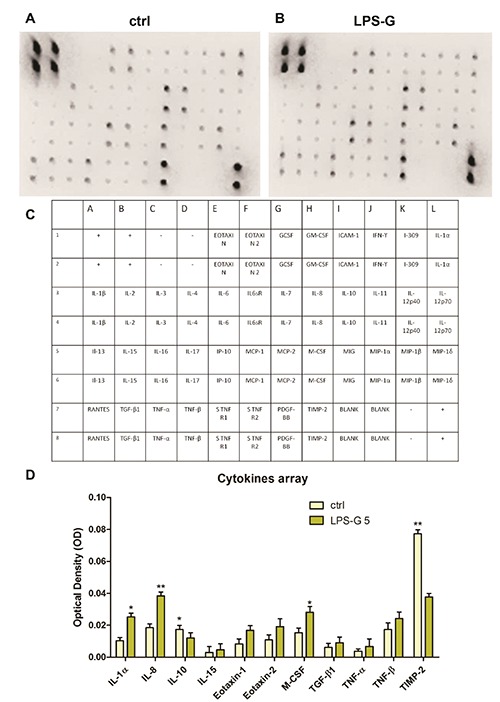
Cytokines release in hPDLSCs in hPDLSCs treated with 5 μg/mL. Cytokines and chemokines release was analysed in medium from untreated and treated hPDLSCs with LPS-G 5 μg/mL hPDLSCs cultures. A, B) Representative arrays used to assess cytokines secreted by primary ctrl hPDLSCs (ctrl) and treated with LPS-G 5 μg/mL (LPS-G); spots on each array represent individual cytokines. C) Table that represents the correspondent membrane cytokine detectable; the upper eight spots on the left corner and the downer four spots on the right of each array are internal standards provided with the array. Spot intensities were quantified densitometrically for each cytokine. D) quantitative data for cytokines whose secretion was significant in cells treated with LPS-G respect to the ctrl cells. Data were expressed as mean ± SEM (*P<0.05, **P<0.01).