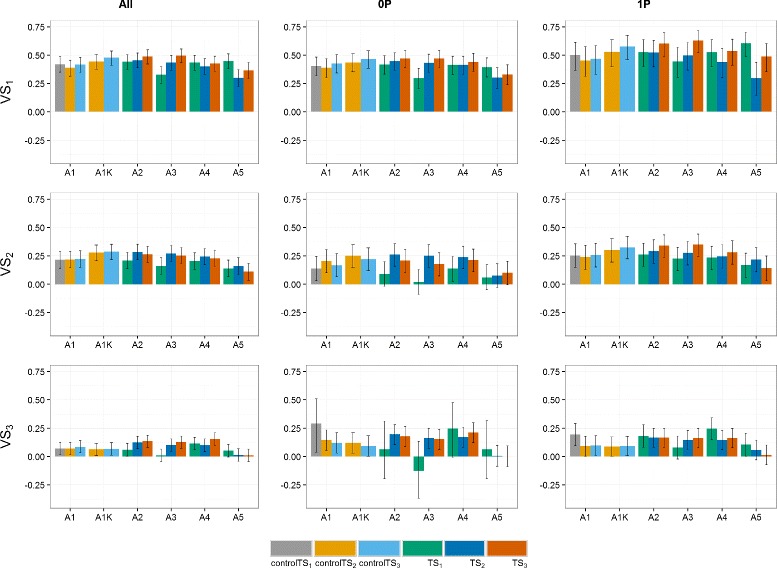
Fig. 2.

Predictive abilities (y-axis) of the German and Polish dataset for the three scenarios. TS1 and controlTS1, TS2 and controlTS2, and TS3 and controlTS3 to predict the validation sets VS1, VS2 and VS3 with All, 0P and 1P-scenarios. Black lines for each bar represent the 95% confidence intervals of the predictive ability. Year-wise approach (A1) and year-wise with kinship approach (A1K) were fitted to the control sets, approaches 2-stg-Kin (A2), 2-stg-Kin-het (A3), 3-stg-NoKin (A4) and 3-stg-Kin (A5) to the complete sets. TS1: GCA1-2009 + GCA2-2010 + GCA3-2011, controlTS1: GCA1-2009, TS2: GCA1-2009 + GCA2-2010 + GCA1-2010 + GCA2-2011, controlTS2: GCA1-2009 + GCA1-2010, TS3: GCA1-2009 + GCA2-2010 + GCA3-2011 + GCA1-2010 + GCA2-2011 + GCA3-2012 + GCA1-2011 + GCA2-2012 + GCA3-2013, controlTS3: GCA1-2009 + GCA1-2010 + GCA1-2011, VS1: GCA1-2012, VS2: GCA1-2013, VS3: GCA1-2014
