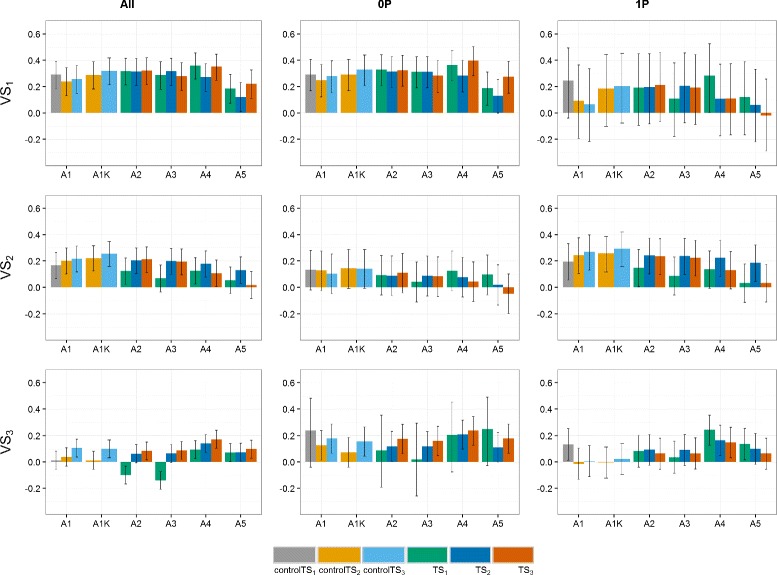
Fig. 4.

Predictive abilities (y-axis) of the Polish dataset for the three scenarios. TS1 and controlTS1, TS2 and controlTS2, and TS3 and controlTS3 to predict the validation sets VS1, VS2 and VS3 with All-, 0P- and 1P-scenarios. Black lines for each bar represent the 95% confidence intervals of the predictive ability. Year-wise approach (A1) and year-wise with kinship approach (A1K) were fitted to the control sets, approaches 2-stg-Kin (A2), 2-stg-Kin-het (A3), 3-stg-NoKin (A4) and 3-stg-Kin (A5) to the complete sets. TS1: GCA1-2009 + GCA2-2010 + GCA3-2011, controlTS1: GCA1-2009, TS2: GCA1-2009 + GCA2-2010 + GCA1-2010 + GCA2-2011, controlTS2: GCA1-2009 + GCA1-2010, TS3: GCA1-2009 + GCA2-2010 + GCA3-2011 + GCA1-2010 + GCA2-2011 + GCA3-2012 + GCA1-2011 + GCA2-2012 + GCA3-2013, controlTS3: GCA1-2009 + GCA1-2010 + GCA1-2011, VS1: GCA1-2012, VS2: GCA1-2013, VS3: GCA1-2014
