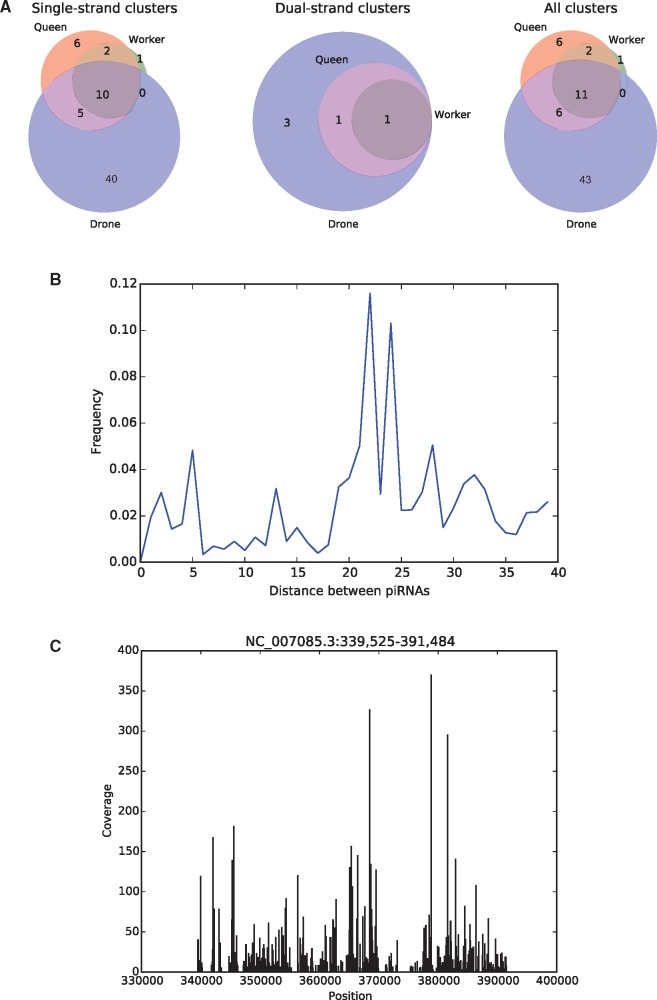
Fig. 9.
—piRNA clusters and phasing in the honeybee. (A) Number of clusters in the different castes. Significantly more clusters were identified in the drone, and most clusters were classified as single-strand. (B) Distribution of the distances between the 3′ end an upstream piRNA and the 5′ end of the next downstream piRNA for all piRNA pairs present in clusters. A peak distance around 20 nt can be observed. (C) An exemplary piRNA cluster.

