Fig. 1.
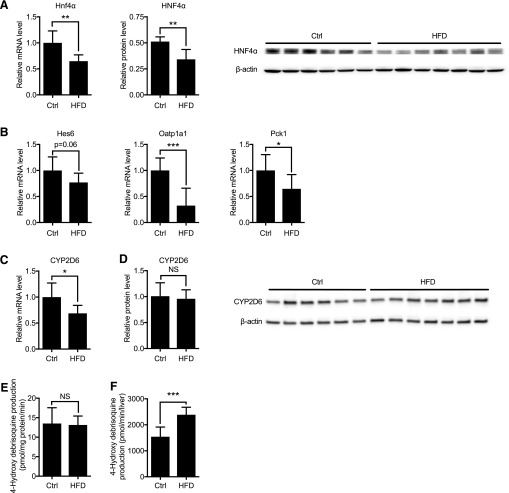
Expression and activity of HNF4α and CYP2D6 in HFD-fed Tg-CYP2D6 mice. Liver tissues were collected from Tg-CYP2D6 mice after 18 weeks of HFD or matching control (Ctrl) diet feeding. (A) Relative Hnf4α mRNA levels (left) determined by qRT-PCR were normalized by that of control group. Relative HNF4α protein levels (right) were normalized against β-actin band intensities. (B) Hepatic mRNA levels of representative HNF4α target genes were determined by qRT-PCR and normalized by that of control group. (C) Hepatic mRNA level of CYP2D6 was normalized by that of control group. (D) CYP2D6 protein level in hepatic S9 fraction (right) was determined using Western blot normalized against β-actin band intensities. (E) CYP2D6 activity in mouse liver S9 fraction was measured using debrisoquine as a substrate. CYP2D6 activity is presented as 4-hydroxydebrisoquine formation rate per mg S9 protein. (F) Total CYP2D6 activity per liver was the product of CYP2D6 activity per mg S9 protein and total S9 protein level per liver. N = 6–8 per group for qRT-PCR and activity assay. Data shown are mean ± S.D. NS, not significant, *p < 0.05, **p < 0.01, ***p < 0.001.

