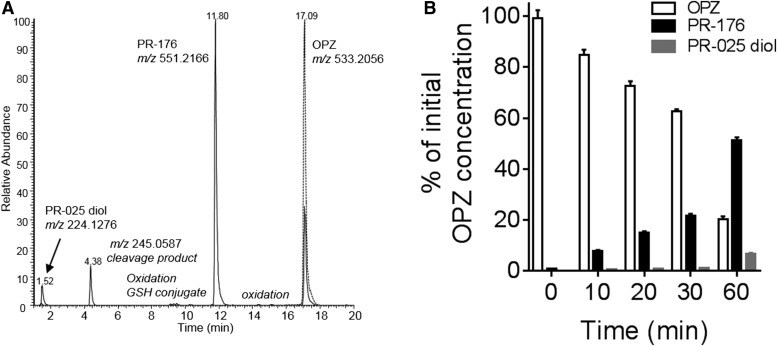
Fig. 2.
In vitro metabolism of oprozomib in human hepatocytes. (A) Representative ion chromatograms of oprozomib metabolites formed in human hepatocytes. Dash line: control sample, cell suspensions spiked with oprozomib; solid line: cell suspensions after 1-hour incubation with oprozomib. (B) Quantitative oprozomib (OPZ) disappearance and metabolite formation in human hepatocytes. At each time point, the levels of oprozomib, PR-176, and PR-025 diol in cell suspensions were quantified and then normalized as the percentage of initial oprozomib concentration at zero minutes. Data represent mean ± S.D. from three replicate incubations. PR-176 was the predominant metabolite formed via epoxide hydrolysis within 1-hour incubation.

