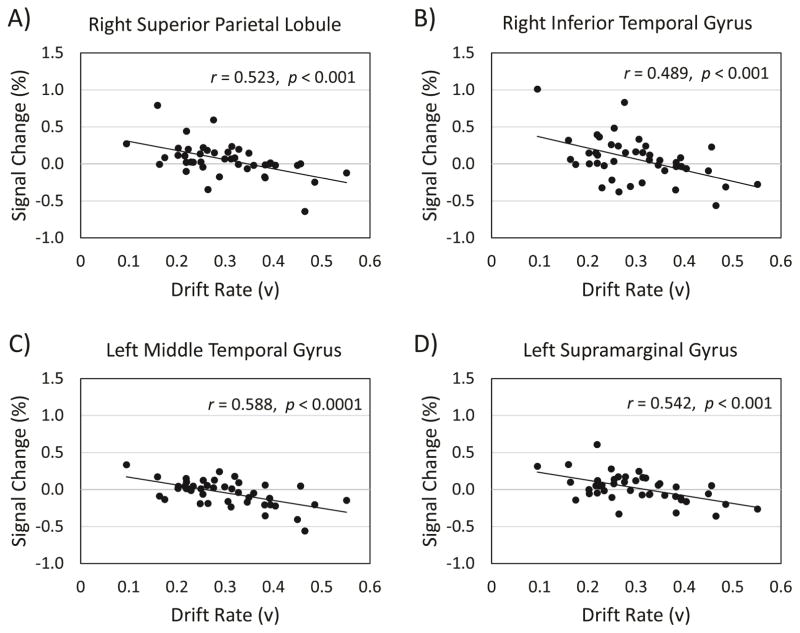
Figure 6.
Correlations between drift rate and activation from the effect of negative distractor images on target detection. Panel A = Negative correlation between drift rate and percent signal change in the right superior parietal lobule. Panel B = Negative correlation between drift rate and percent signal change in the right inferior temporal gyrus. Panel C = Negative correlation between drift rate and percent signal change in the left middle temporal gyrus. Panel D = Negative correlation between drift rate and percent signal change in the left supramarginal gyrus.

