
FIG 3.
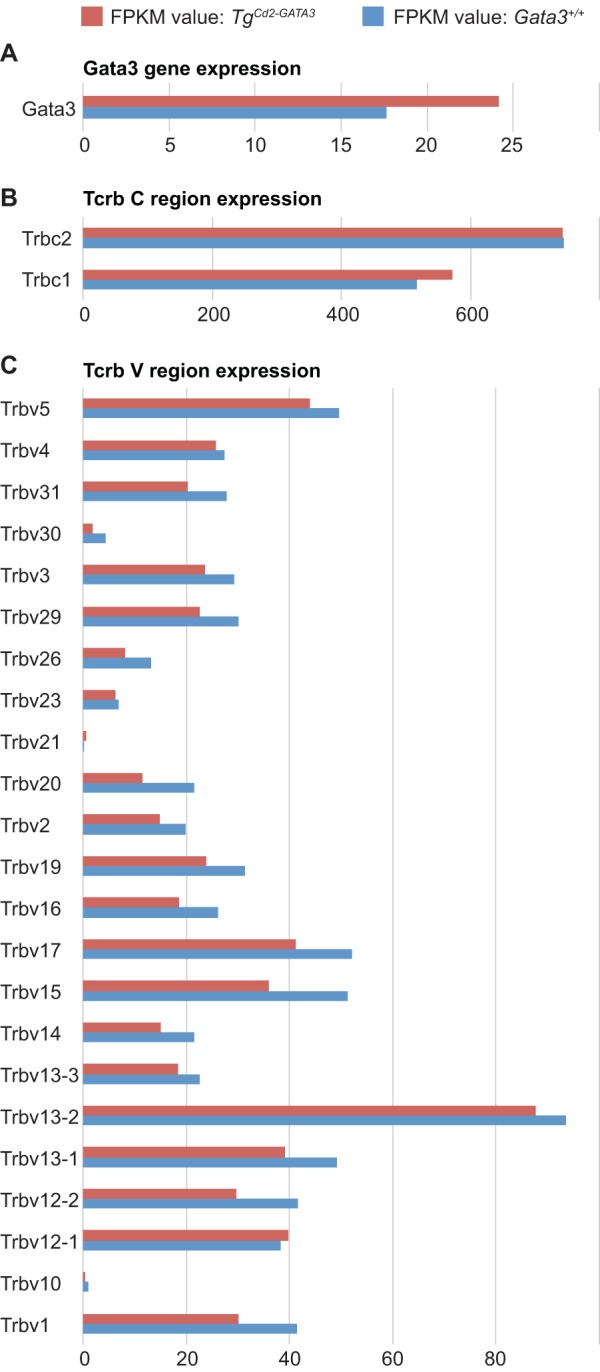
RNA-seq analysis of transcript abundance and V-region utilization in TgCd2-GATA3 DN3a stage cells. The transcript abundances of GATA3 (A), two Tcrb constant regions (B), and multiple V regions (C) were quantified as fragments per kilobase per million (FPKM). None of the Tcrb regions showed a statistically significant difference (FDR of <0.05) between Tg and control wild-type cells.