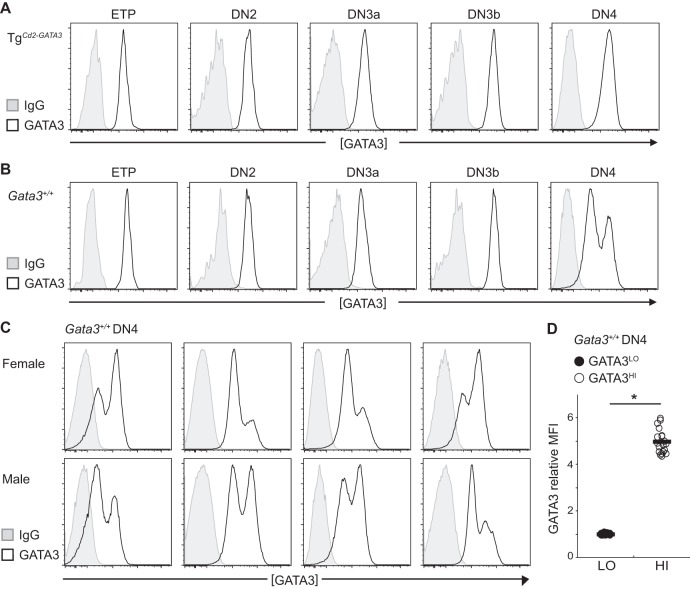
FIG 8.
Profiles of GATA3 in wild-type and mutant cells. (A and B) Representative histograms of intracellular GATA3 protein abundance analyzed by flow cytometry in ETP, DN2, DN3a, DN3b, and DN4 stage thymocytes isolated from 5- to 8-week-old TgCd2-GATA3 mice (A) and wild-type (Gata3+/+) mice (B). Thymocytes were first stained for the cell surface markers used to distinguish between the various early developmental T cell stages (Materials and Methods) and then fixed and stained for intracellular GATA3 or IgG. (C) Gender-independent GATA3 protein expression in DN4 stage cells. Shown are intracellular GATA3 protein abundances in DN4 stage thymocytes from female (top) or male (bottom) wild-type animals. Eight individual animals were analyzed in seven independent experiments. (D) Quantification of GATA3 protein abundance in wild-type DN4 stage cells by flow cytometry as described above for panel C. The relative abundance of GATA3 was calculated based on the MFI of the GATA3HI population normalized to the GATA3LO population to eliminate the fluorescence intensity alteration due to flow cytometry settings that differ in independent experiments. Each circle represents results for an individual animal. Solid bars indicate the averages for each genotype. *, P < 0.05.

