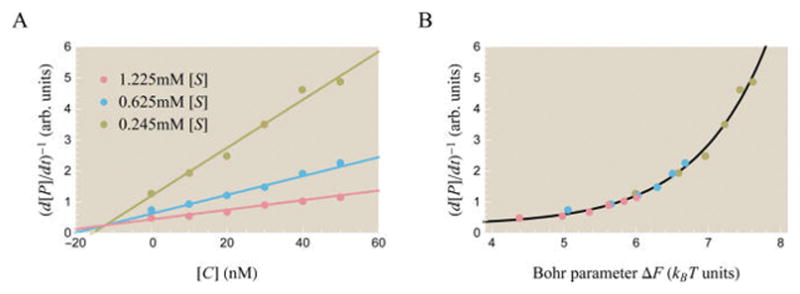
Figure 11.

Theoretically and experimentally probing the effects of a competitive inhibitor on activity. (A) Data points show experimentally measured activity in arbitrary units from Li et al. for the enzyme α-amylase using substrate analogue [S] (α-maltotriosyl fluoride) and competitive inhibitor [C] (isoacarbose).51 Best fit theoretical curves described by the inverse of eq 65 are overlaid on the data. The best fit parameters are e−β(εA−εI) = 36, , and . Note that the x-axis varies [C] rather than [S] as in most other plots. (B) A data collapse of the three curves using the Bohr parameter ΔF from eq 68 which encompasses the effects of both the substrate and inhibitor upon the system.
