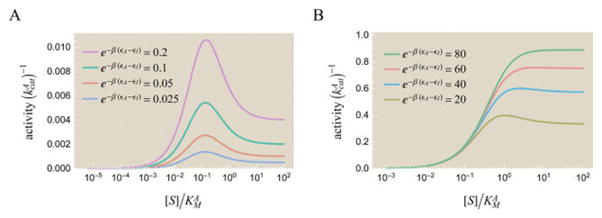
Figure 13.
Peaks in enzyme activity as a function of substrate concentration [S]. Activity is shown in units of , which rescales the activity curves vertically. The peak for (A) small and (B) large ratios of the enzyme’s energy in the active versus inactive state, e−β(εA−εI). The height of the peak increases with e−β(εA−εI). The activity is computed from eq 70 using the parameters , and the different values of e−β(εA−εI) shown. As predicted by eq 71, every value in the range will yield a peak in activity. While the peak is more pronounced when the active state is energetically favorable (e−β(εA−εI) < 1) in part A, the maximum peak height is much larger in part B, as seen by the different scale of the y-axis.

