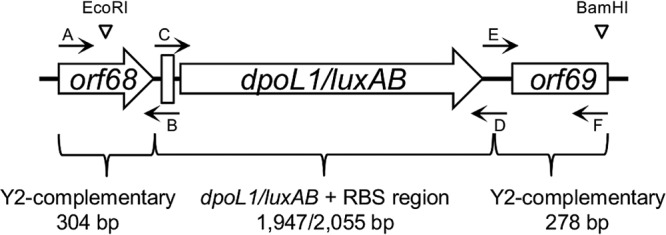
FIG 8.

Schematic representation of the construct generated by overlap PCR for cloning into pBluescript and subsequent homologous recombination with Y2 genomic DNA. Annealing regions of the primers are depicted by small black arrows, and the restriction sites of EcoRI and BamHI, as well as the RBS (thick vertical line), are indicated. The image is not drawn to scale.
