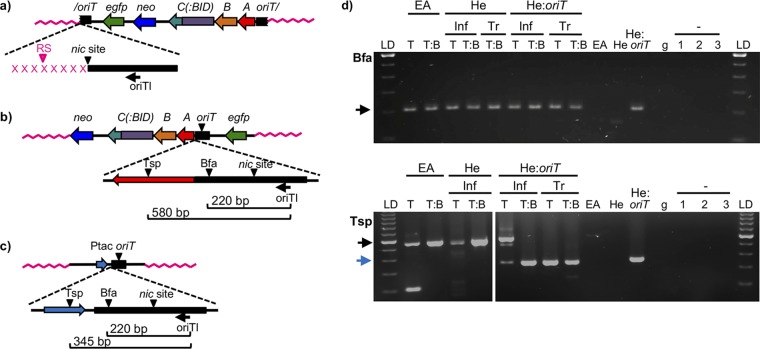
FIG 3.
Analysis of LAM-PCR products. (a to c) Scheme of the expected integration events and the subsequent LAM-PCR products. (a) If integration takes place by the 5′ end of the nic site, the size of the LAM-PCR would be determined by the distance to the nearest restriction site in the human genome (in pink). Each integration event occurring in a different locus would generate a band of a different size. The nicked oriT is indicated by a slash. (b) If the plasmid becomes integrated at any other region than the nic site, the size of the LAM-PCR product would be always the same and would be determined by the distance to the restriction site in the plasmid sequence. Bfa, BfaI; Tsp, Tsp509I. (c) In HeLa::oriT cell line, in addition to the bands generated from the integration events, the oriT copy present in the pMTX708/pMTX709 plasmid generates a single band of a size determined by the distance to the restriction site in the plasmid sequence. trw has been omitted from trwA, trwB, and trwC for clarity. (d) Gel electrophoresis of LAM-PCR products obtained when using BfaI (top gel) or Tsp509I (bottom gel) restriction enzymes. The cell line is indicated in the top row (EA, EA.hy926; He, HeLa; He:oriT, HeLa::oriT). Inf, samples obtained after Bartonella infection; Tr, samples obtained by transfection of plasmid DNA; LD, 100-bp ladder; T, trwC-coding plasmid (pCOR31); T:B, trwC::BID-coding plasmid (pCOR33). EA, He, and He::oriT, samples from uninfected cell lines. g, human genomic DNA (Roche), used as negative control. The − sign with 1 to 3, negative controls (no DNA) of linear, first, and second exponential PCRs, respectively. The arrows indicate the bands of the expected size according to panels b (black arrows) and c (blue arrow).

