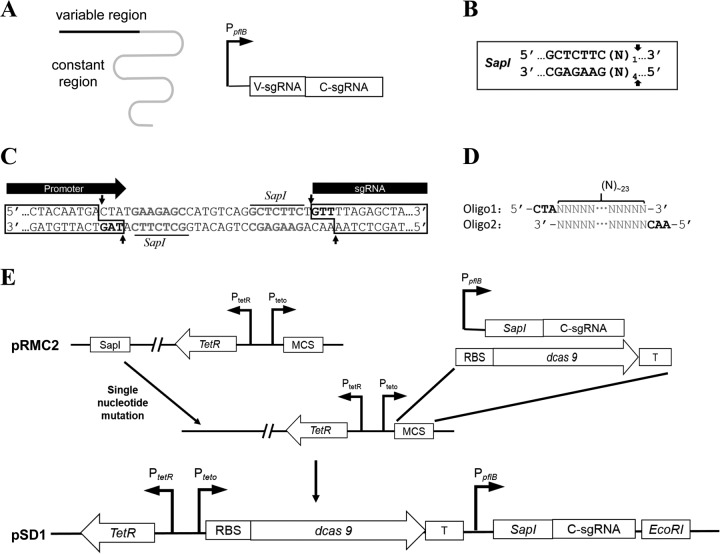
FIG 1.
Schematic outline of the construction of dCas9 and sgRNA expression plasmid pSD1. (A) Schematic representation of sgRNA and organization of sgRNA expression cassette. The black line represents the sgRNA variable region for target DNA binding, and the gray line represents the constant region for dCas9 binding. (B) Recognition sequence and SapI cutting sites. The arrows indicate the cutting sites, and N represents any one of the four nucleotide bases. (C) Partial sequence of the modular sgRNA expression cassette. The gray bold nucleotides are the SapI recognition sequences, and arrows indicate the SapI cutting sites. Two 5′ overhang regions of 3 nt each (black bold) are produced upon SapI digestion. (D) Target-specific oligonucleotides coding for the sgRNA variable region. The gray sequences of the two oligonucleotides are complementary to each other, about 23 nt. A hybrid form of the two oligonucleotides has two 5′ overhangs (in black) for cloning into the SapI-digested sgRNA expression cassette. (E) Schematic diagram of plasmid pSD1 construction. Abbreviations: T, transcription terminator; MCS, multiple cloning site; V-sgRNA, coding sequence of the sgRNA variable region; C-sgRNA, coding sequence of the sgRNA constant region.

