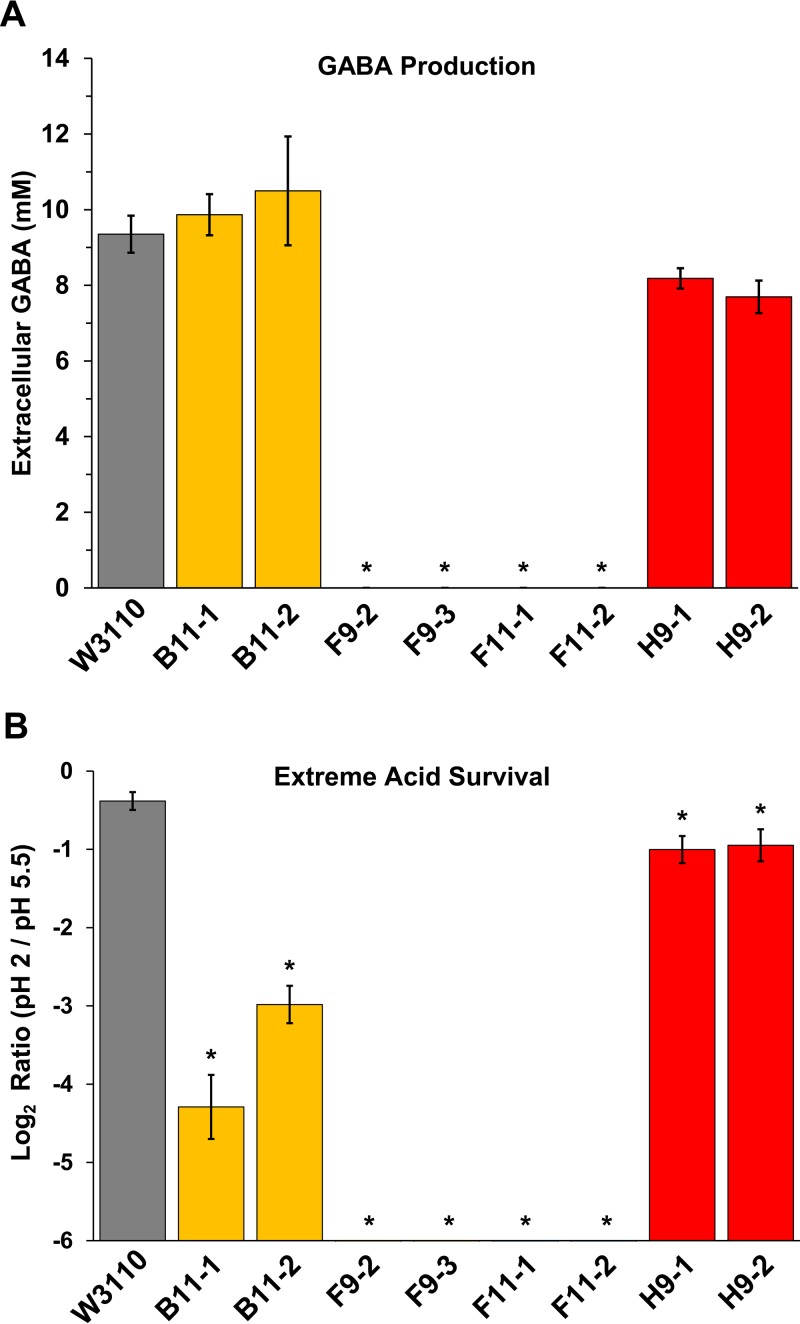
FIG 3.
GABA production and extreme-acid survival of acid-evolved strains. (A) GABA assays of anaerobic overnight cultures after exposure at pH 2.0 for 2 h, as measured by GC-MS (see Materials and Methods). ANOVA tests identified no significant difference in GABA production levels between strains W3110, B11, and H9. (B) Survival of overnight cultures after dilution and incubation at pH 2.0 for 2 h (see Materials and Methods). The y axis shows the log2 ratios of the colony counts at the indicated pH values. The axis cutoff (10−6) represents the lower limit of colony detection. One-way ANOVA tests were run with the Tukey method comparison to identify significantly different groups. Asterisks indicate strains that show significant difference in results from those of the ancestral strain W3110 (P < 0.05).

