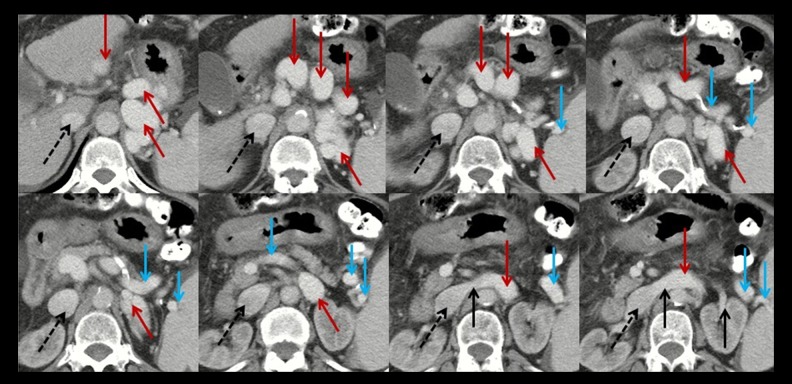
Figure 1.
Axial contrast-enhanced computed tomography at the portal vein phase in a 63-year-old female patient with spontaneous splenorenal shunt (HXY). Black dashed arrows represent the inferior vena cava; black solid arrows represent the left renal vein; blue solid arrows represent the splenic vein; red solid arrows represent the communication between splenic vein and left renal vein.

