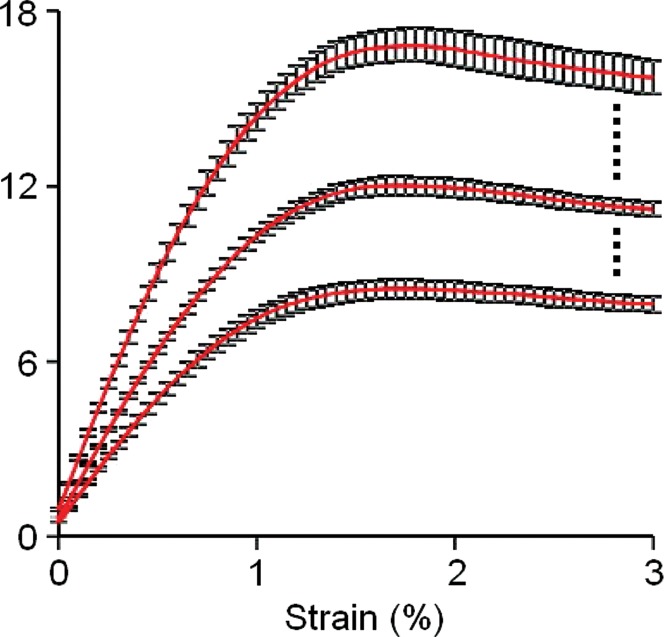
Figure 3b:
Graphs show the response of bone to applied strain in (a) a horizontal sideways-fall position and (b) a vertical standing position. Each individual underwent imaging and analysis in triplicate, and the results were averaged. The strongest, weakest, and median cases from the total group of 13 individuals are displayed on each graph with standard error.

