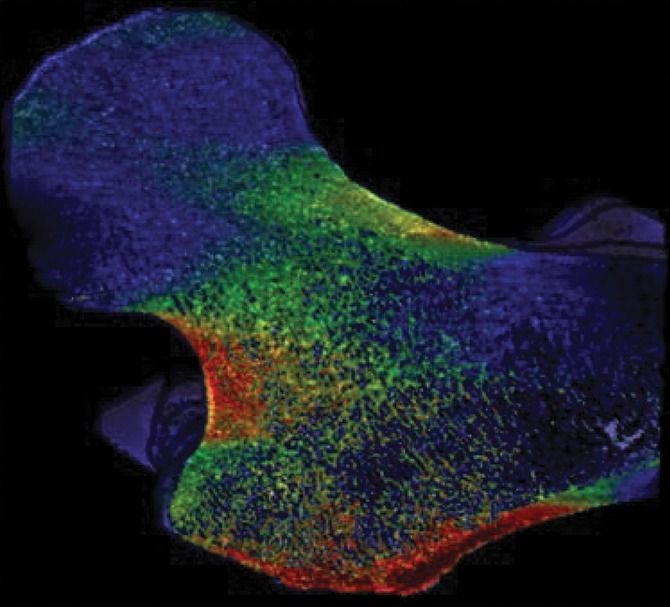
Figure 4d:

Strain map comparison between (a, c) a 56-year-old woman who received a diagnosis of osteoporosis and (b, d) a “healthy” 28-year-old man with a DXA total hip T score well short of the criterion for osteoporosis (criterion of −1.2). The comparatively reduced trabecular bone volume can be seen at visual inspection in the patient with osteoporosis (a and c); however, this patient never fractured her hip, whereas the patient on b and d sustained a hip fracture (in the contralateral femur). Regular DXA results led to classification of the patient on a and c as having a higher risk for fracture; however, the strain map clearly shows the “healthy” patient on b and d to be more susceptible to fracture.
