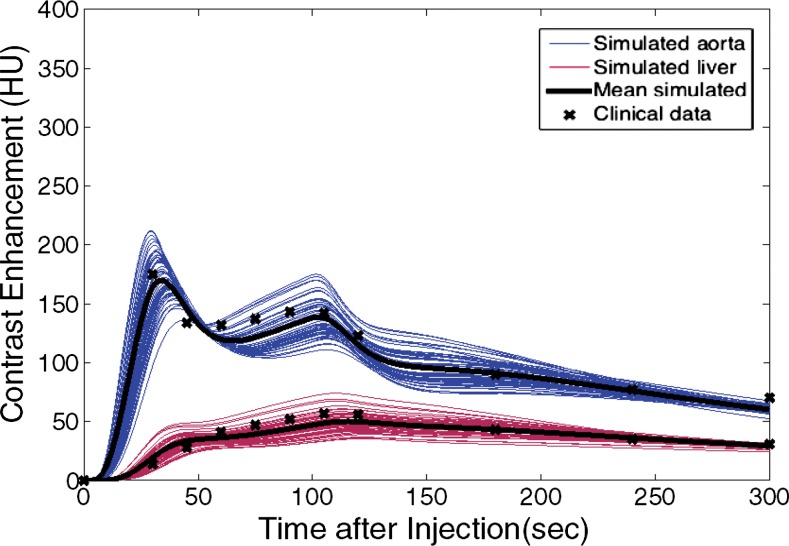
Figure 7b:
Graphs show simulated and clinical aortic and hepatic contrast-enhancement time curves with (a) uniphasic and (b) biphasic injections. Simulated results are shown with thin solid curves for the aorta (blue) and liver (red). Thicker black curves represent mean value of simulation data for each data set.

