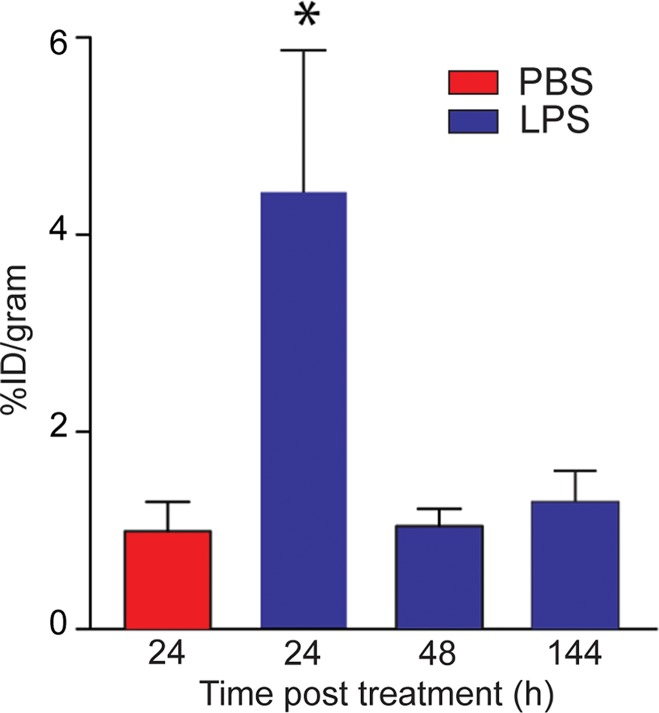
Figure 3c:
PET 64Cu-DOTA-ECL1i imaging in mouse lung injury model. Mice received intratracheal PBS or LPS followed by intravenous injection of 64Cu-DOTA-ECL1i. (a) Representative PET images of maximum intensity projection reconstructed PET/CT scans (center) and from indicated planes acquired 24 hours after treatment and after injection with 64Cu-DOTA-ECL1i . (b) Time-activity curves of 64Cu-DOTA-ECL1i in heart and lungs from 0 to 60 minutes after injection (n = 3 per group from subgroup described in c). * = P < .001 compared with lung PBS and LPS groups (unpaired two-tailed Student t test). Data are means ± standard deviations. (c) Bar chart shows 64Cu-DOTA-ECL1i lung uptake after treatment (PBS: n = 5; LPS: n = 7 at 24 hours, n = 3 at 48 hours, n = 3 at 144 hours). * = P < .001 compared with PBS. Data are means ± standard deviations. (d) Uptake in lung after delivery of low (n = 3), intermediate (Int) (n = 7), and high (n = 3) dose of LPS. Intermediate dose activity is same data as shown in c for comparison. Data are means ± standard deviations. * = P < .001 and ** = P = .006 compared with low-dose LPS (one-way analysis of variance with Tukey test).

