
Figure 1.
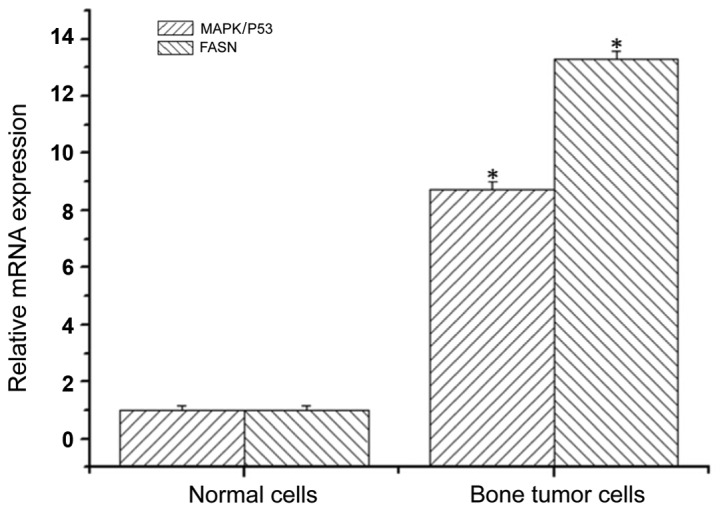
Expression levels of MAPK/P53 and FASN mRNA in normal cells and SH081 bone tumor cells. Asterisk indicates significant difference between groups (P<0.05). MAPK, mitogen-activated protein kinase; FASN, fatty acid synthase.
Official websites use .gov
A
.gov website belongs to an official
government organization in the United States.
Secure .gov websites use HTTPS
A lock (
) or https:// means you've safely
connected to the .gov website. Share sensitive
information only on official, secure websites.
Expression levels of MAPK/P53 and FASN mRNA in normal cells and SH081 bone tumor cells. Asterisk indicates significant difference between groups (P<0.05). MAPK, mitogen-activated protein kinase; FASN, fatty acid synthase.