Figure 2.

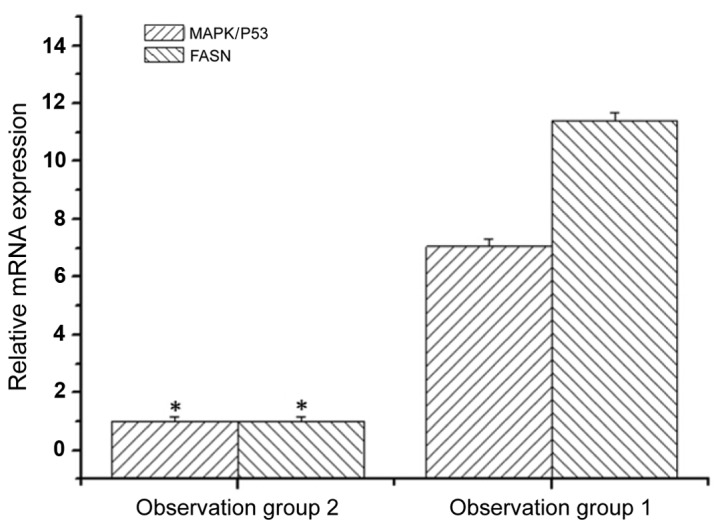
Expression levels of MAPK/P53 and FASN mRNA in SH081 bone tumor cells treated with MAPK/P53 inhibitor. Asterisk indicates significant difference between groups (P<0.05). MAPK, mitogen-activated protein kinase; FASN, fatty acid synthase.

Expression levels of MAPK/P53 and FASN mRNA in SH081 bone tumor cells treated with MAPK/P53 inhibitor. Asterisk indicates significant difference between groups (P<0.05). MAPK, mitogen-activated protein kinase; FASN, fatty acid synthase.