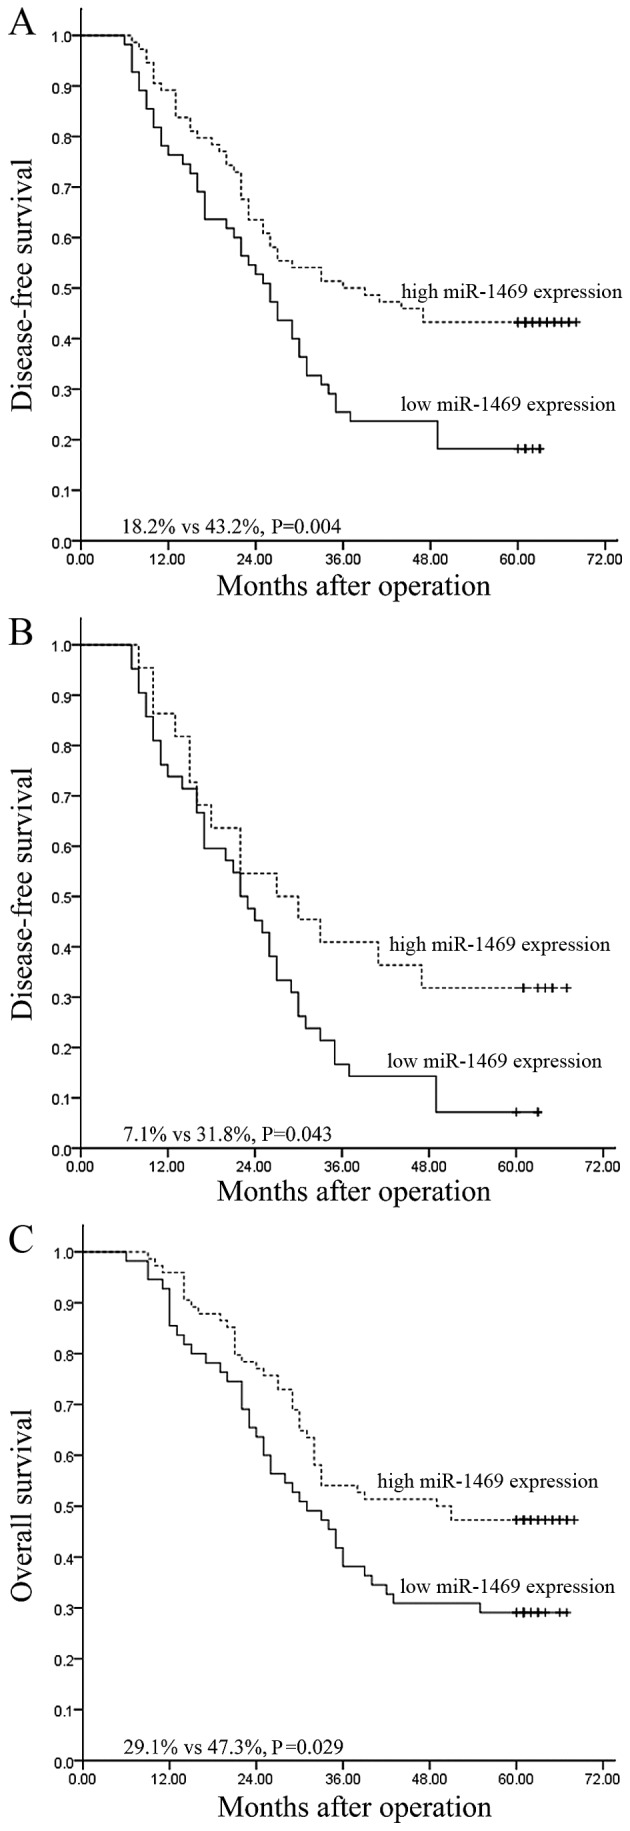
Figure 1.

Kaplan-Meier survival curves stratified according to miR-1469 expression levels. The survival curves represent (A) the DFS of all patients, (B) the DFS of patients with N1-3 disease and (C) the overall survival of all patients. DFS, disease-free survival.
