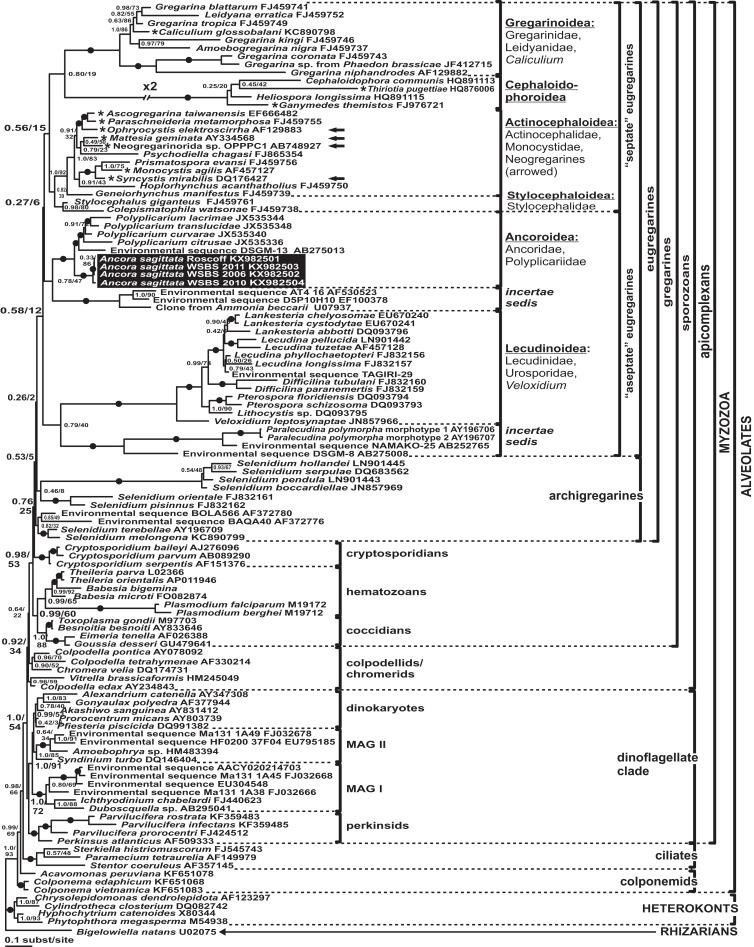
Figure 7. Bayesian inference tree of alveolates calculated by using the GTR+Г+I model from the dataset of 114 SSU rDNA sequences (1,570 sites).
Numbers at the nodes indicate Bayesian posterior probabilities/ML bootstrap percentage. Black dots on the branches indicate Bayesian posterior probabilities and bootstrap percentages of at least 0.95% and 95%, respectively. The newly obtained sequences of Ancora sagittata are highlighted in by a black rectangle. Asterisks indicate aseptate gregarines within the “septate” clade; arrows indicate neogregarines.

