
Table 1.
Biochemical analyses of orthogonal enzyme-substrate pairs.
| Enzyme | % WT light emissiona | Normalized kcat/KMb | λmax (nm) | Compound |
|---|---|---|---|---|
|
| ||||
| A | 1.2 ± 0.35 | 0.041±0.016 | 612 |
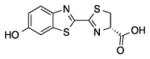 D-luc |
| B | 0.92 ±0.17 | 0.013 ± 0.004 | 616 | |
| C | 94 ± 8.4 | 5.22 ± 0.58 | 570 | |
|
| ||||
| A | 0.19±0.02 | 0.034 ± 0.008 | 614 |
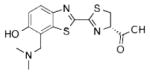 2b |
| B | 0.33 ± 0.09 | 0.050 ± 0.020 | 614 | |
| C | 17 ±5.2 | 5.0 ±1.3 | 574 | |
|
| ||||
| A | 0.16 ±0.02 | 0.253 ±0.065 | 614 |
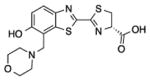 2c |
| B | 3.7 ± 0.76 | 1.09 ± 0.36 | 618 | |
| C | 16 ± 2.3 | 8.2 ±2.2 | 600 | |
|
| ||||
| A | 0.47 ±0.01 | 0.121 ±0.025 | _c |
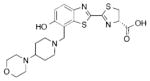 2d |
| B | 0.81 ± 0.09 | 0.155 ±0.061 | 604 | |
| C | 22 ±2.3 | 6.0 ±1.7 | 570 | |
|
| ||||
| A | 38 ±13 | 17.1 ± 6.4 | 622 |
 3b |
| B | 200 ± 41 | 83 ±37 | 628 | |
| C | 13 ± 2 | 13.1 ± 5.7 | 626 | |
a
Values normalized to each compound’s corresponding emission with WT Fluc. Errors represent standard error of the mean for n = 3 measurements.
b
Kinetic constants are apparent values, determined via measurements of initial rates of light emission over a range of 2 μM to 10 mM. Errors represent standard error of the mean for n≥3 measurements. kcat values are relative to each compound’s corresponding value with WT Fluc. Errors represent standard error of the mean for n ≥ 3 measurements.
c
λmax value could not be determined due to low level of light emission.