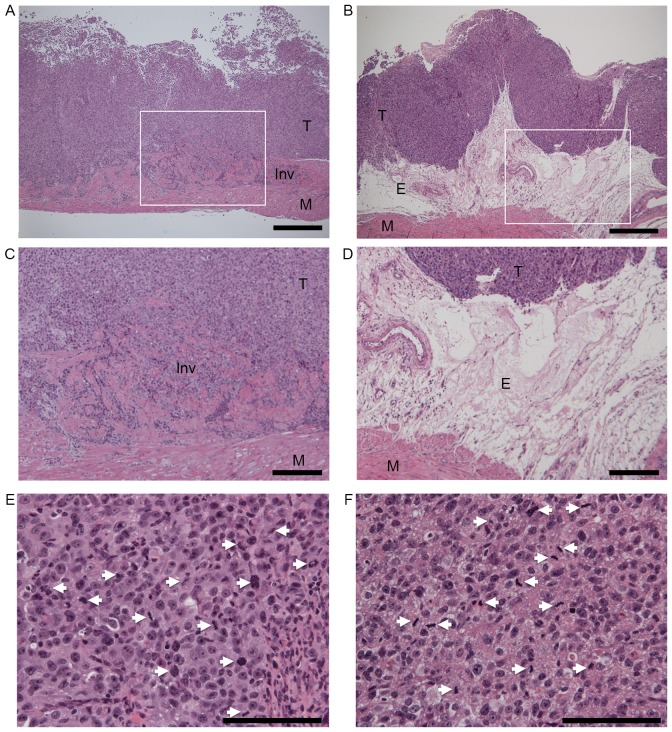
Figure 2.
Histopathological examinations of (A) vector control and (B) periostin-expressing UMUC-3 bladder tumors in a mouse orthotopic model of bladder cancer. Hematoxylin and eosin (HE) stain, magnification ×40. Scale bars represent 500 µm. (C and D) are higher magnification of (A and B), respectively. White squares in (A and B) indicate the area of (C and D), respectively. (C) Invasive growth of vector control UMUC-3 bladder tumor. (D) Edematous lesions of periostin-expressing UMUC-3 bladder tumor (magnification, ×100). Scale bars represent 200 µm. (E) Mitotic figures in vector control and (F) periostin-expressing UMUC-3 bladder tumors (magnification, ×400). Scale bars represent 100 µm. The white arrows indicate mitotic cells. Mitotic counts were performed using a standard laboratory microscope (magnification, ×40). Mitotic activity index (mitotic figures/3 hpfs) of mouse orthotopic bladder tumors was determined using the number of mitotic figures in three randomly-selected hpfs. T, tumor; M, muscular layer; E, edematous lesion; Inv, Invasive growth; hpfs, high power fields.

