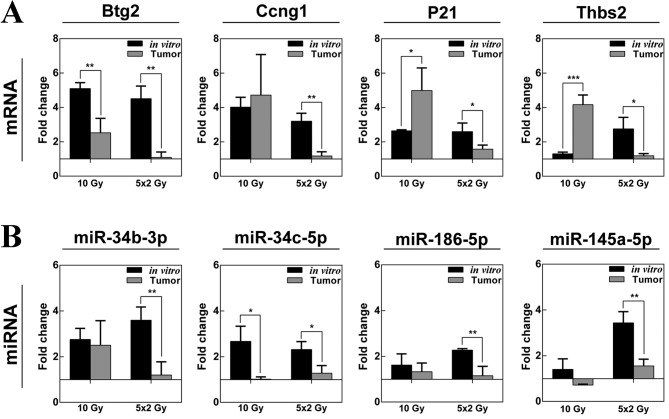
Figure 3.
Validation of microarray gene and miRNA expression data through quantitative polymerase chain reaction analysis. Graphs showing the fold-change of selected (A) genes (Btg2, Ccng1, p21 and Thbs2) and (B) miRNAs (miR-34b-3p, miR-34c-5p, miR186-5p and miR-145a-5p) in LLC1 cells in vitro and in mouse LLC1 xenograft tumors following exposure to a single dose (10 Gy) or fractionated dose (5×2 Gy) radiation compared with the expression levels in untreated cells. Results are presented as the mean ± standard deviation (n=3). *P<0.05; **P<0.01; ***P<0.001.

